What your team sees
SCREEN 1 OF 7
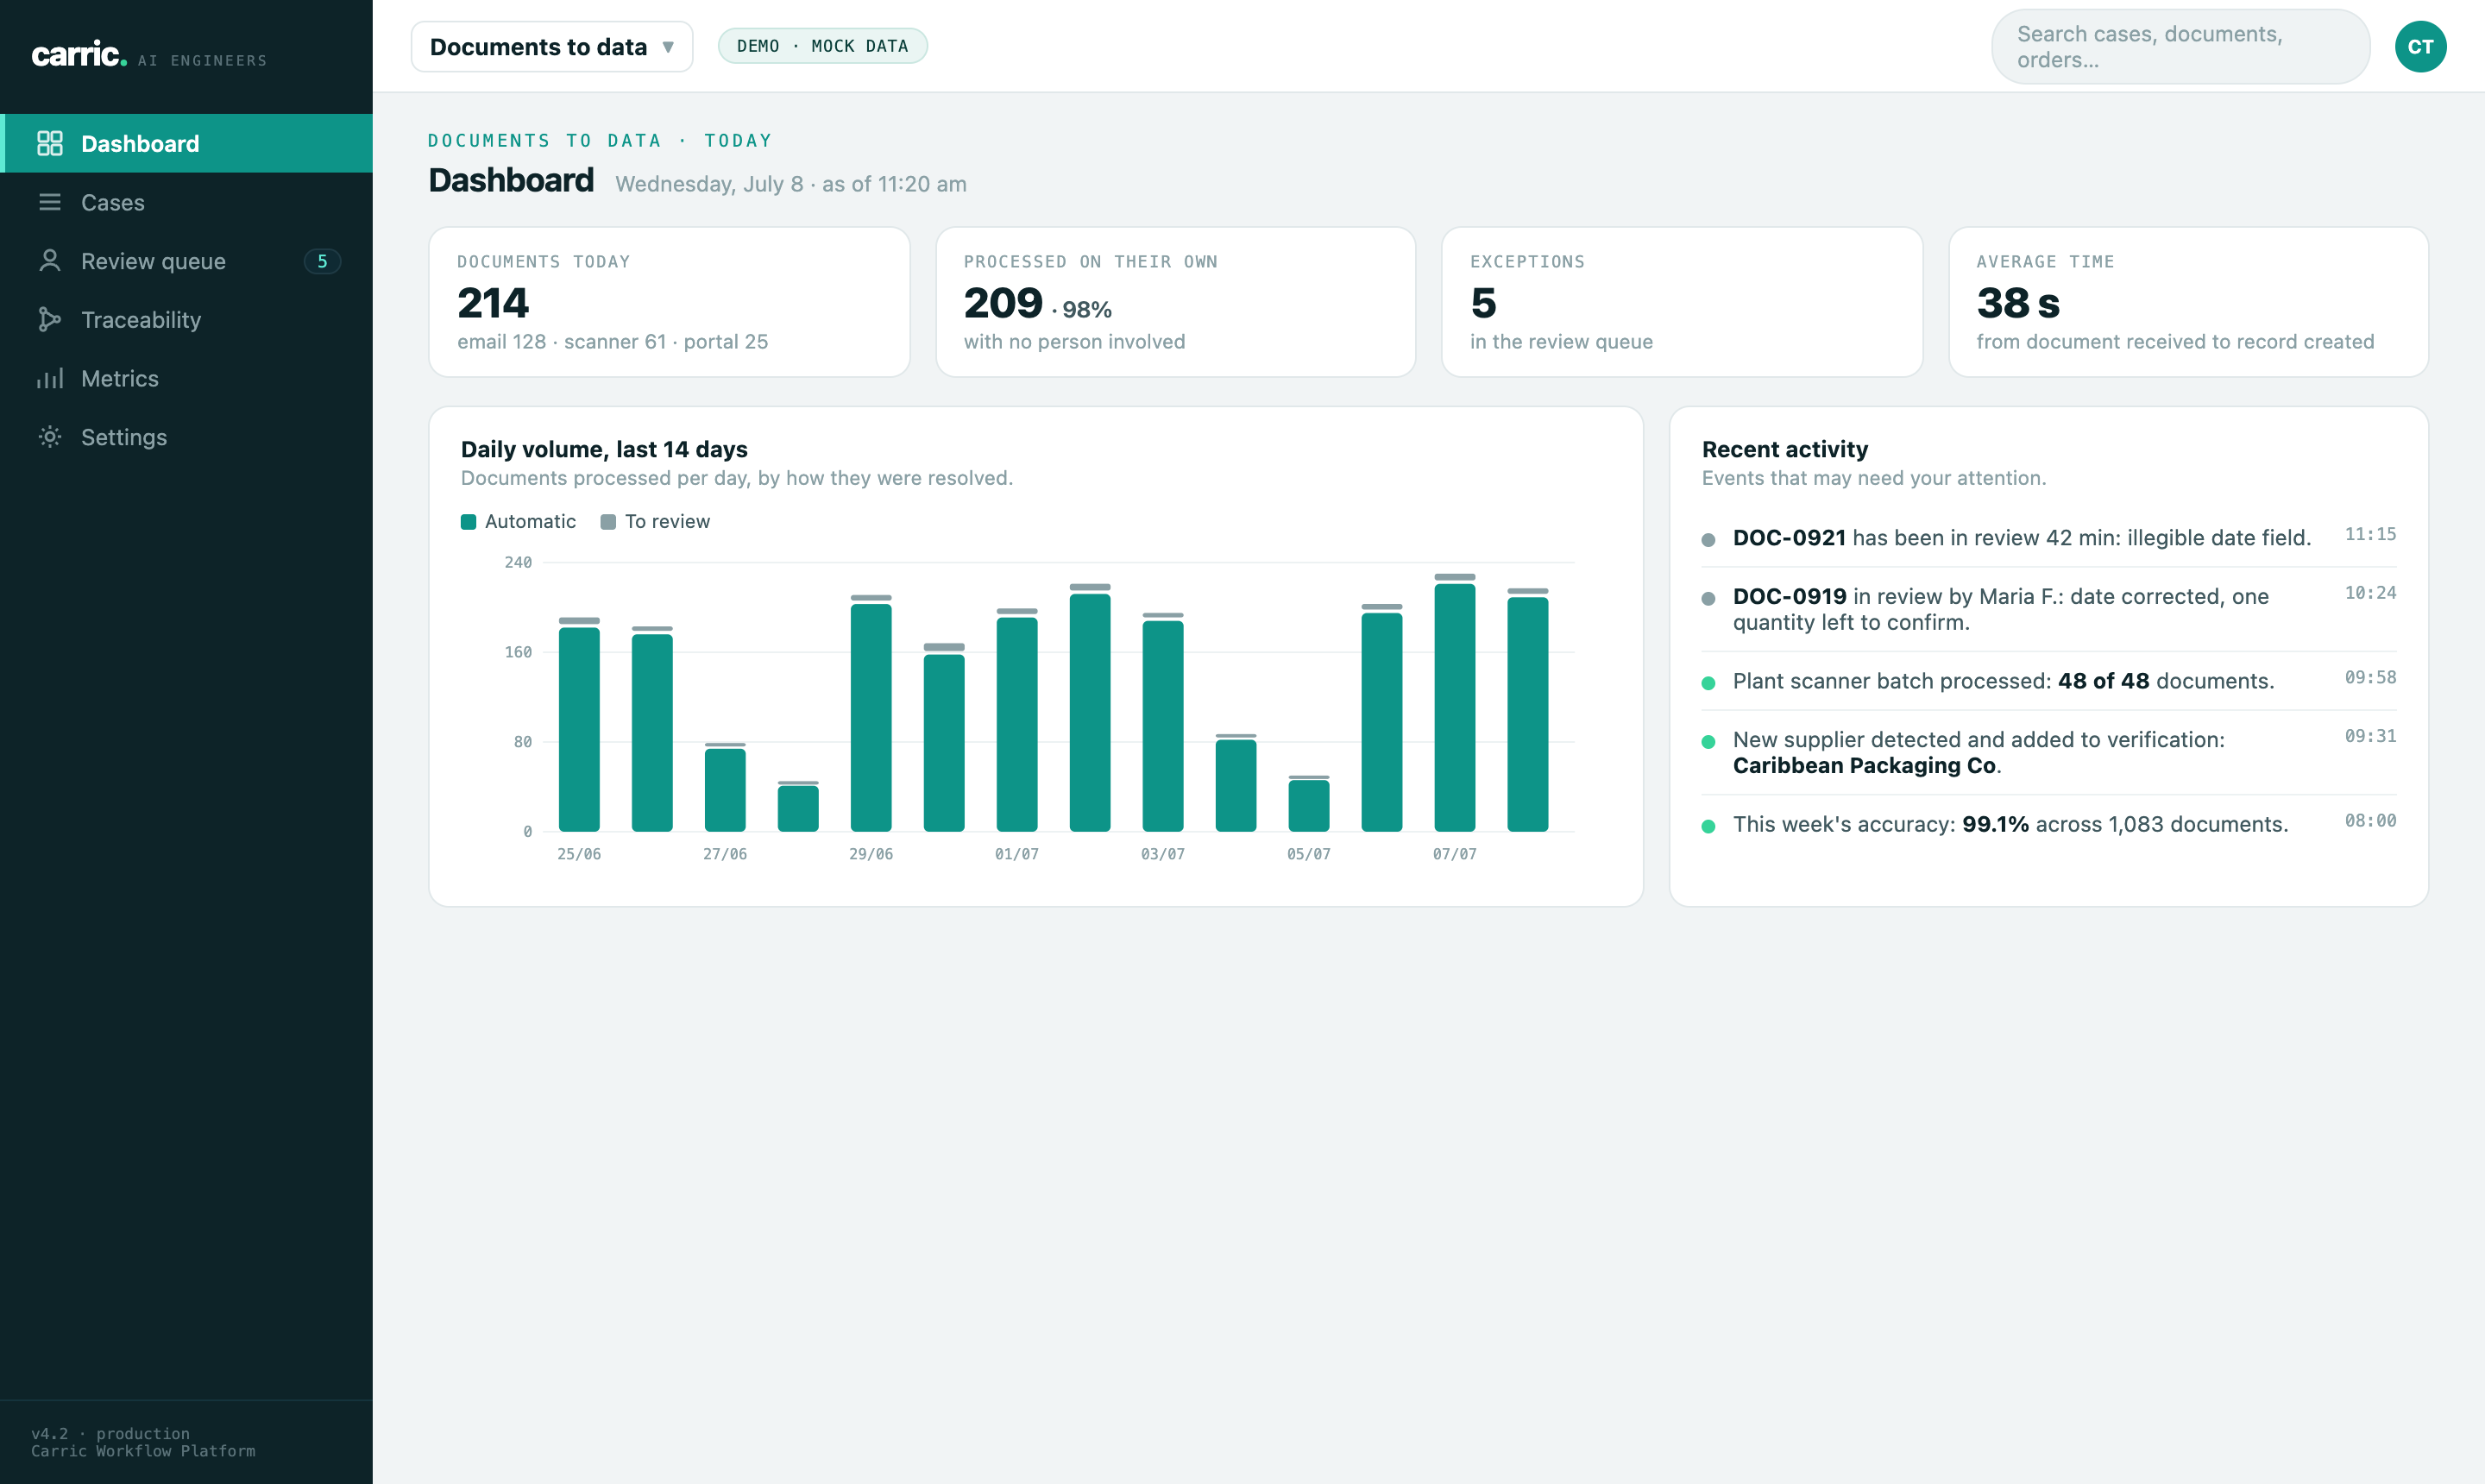
Dashboard
See workflow volume, exceptions, speed, and recent activity in one view.
Open full image
See the Carric OPS interfaces your team uses.
Monitor case execution, review exceptions, inspect decision traces, and measure operating performance. Choose an interface below.
This prototype uses mock data. Its numbers show how the interface works.
Next: How it is built
See how policies, models, people, and platform controls work together.